18 May 2026
How Data Analytics Drive College Basketball Spread Variations on Digital Sportsbooks
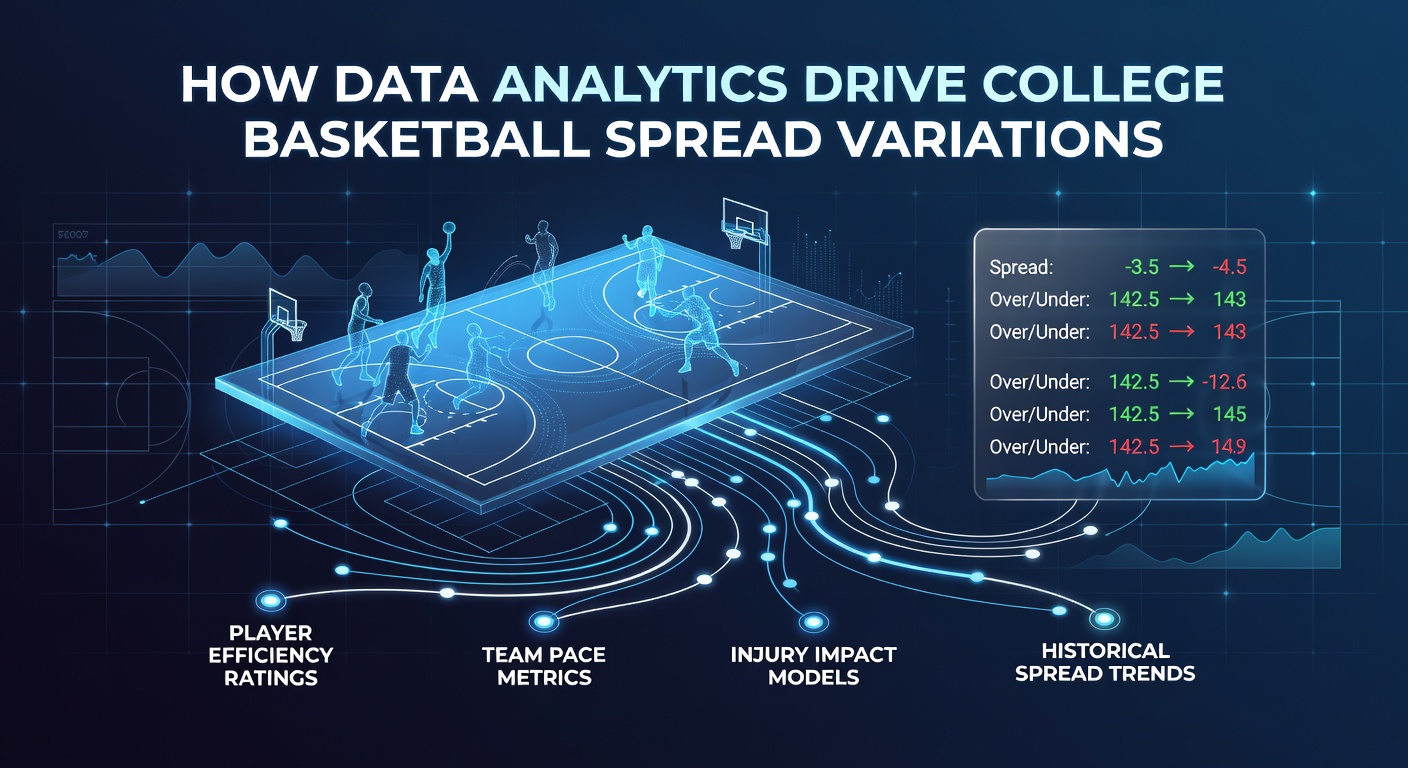
Data analytics shape how point spreads move in college basketball markets across digital sportsbooks, and researchers track these shifts through layers of statistical models that process everything from player efficiency ratings to travel schedules. Teams compile datasets covering thousands of games each season, then feed those numbers into algorithms that predict outcomes with increasing precision, while bookmakers adjust lines in response to incoming wagers and updated projections. Observers note that spreads rarely stay static once markets open, because fresh information arrives constantly through injury reports, weather impacts on travel, and even practice footage analyzed by computer vision tools.
Core Data Sources Behind Spread Calculations
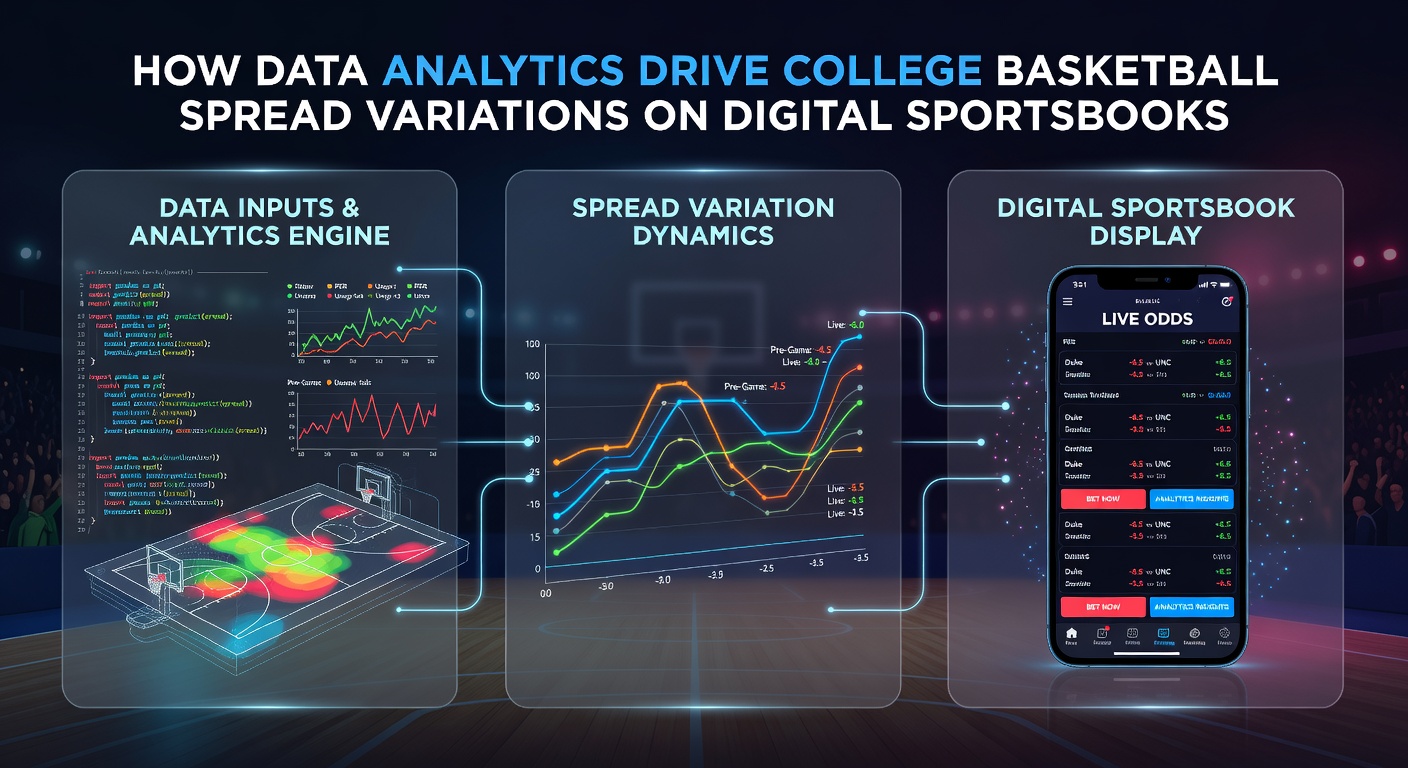
College basketball analytics teams pull from official box scores, advanced metrics like adjusted efficiency margins, and historical head-to-head results that stretch back decades, then layer on situational factors such as rest days between games or conference tournament seeding implications. Digital sportsbooks integrate these inputs with real-time betting patterns, so a surge of money on one side triggers automated recalibrations that widen or narrow the number by half-point increments. Studies from institutions like Carnegie Mellon University show how machine learning models reduce prediction error rates compared with older manual methods, and those improvements translate directly into tighter initial spreads that still fluctuate once live action begins.
Real-Time Adjustments During the Season
Throughout a typical campaign, spreads shift multiple times before tip-off because data pipelines refresh continuously with the latest performance indicators, and May 2026 marks another off-season period when analysts review full-year datasets to refine models for the upcoming schedule. Bookmakers monitor volume across thousands of accounts simultaneously, spotting coordinated betting that often signals sharp action, then respond by moving lines to balance risk exposure. What's interesting is how conference play introduces additional variables, since strength-of-schedule adjustments and travel distance calculations alter projected margins by several points in certain matchups.
Impact on Digital Sportsbook Operations
Operators rely on sophisticated risk engines that blend historical college basketball data with current market sentiment, allowing spreads to reflect both statistical probability and liability management at the same time. When public money flows heavily toward favorites in high-profile games, algorithms detect the imbalance and nudge the number accordingly, often creating value on the opposite side for bettors who follow contrarian signals. Research indicates that these automated responses occur within seconds of significant wager thresholds being crossed, keeping markets liquid while protecting against large-scale losses. Turn to sources such as reports from the American Gaming Association for broader context on how technology influences North American betting markets, and note parallel findings in Australian regulatory reviews that examine similar data-driven adjustments in other sports.
One analyst who examined thousands of lines from recent seasons discovered that mid-major conference games experience larger spread swings than power-conference matchups, largely because fewer public data points exist for those teams and models rely more heavily on limited scouting information. Yet the same study revealed that once a tournament field expands, analytics coverage becomes more uniform across all participants, reducing volatility in later rounds. Those who've studied this pattern observe that spreads in the NCAA tournament often tighten as more data accumulates from earlier games, while regular-season lines remain more fluid because of ongoing roster changes and academic eligibility issues.
Player Performance Metrics and Line Movement
Advanced tracking systems now capture shot location, defensive assignments, and pace metrics that feed directly into spread projections, and digital platforms update these values hourly during the week leading up to tip-off. A key player returning from injury can shift a line by three or four points within minutes once medical reports hit the wires, demonstrating how granular health data influences market pricing. Observers note that tempo statistics prove especially predictive in college basketball, where slower-paced teams tend to cover spreads more consistently against faster opponents, and bookmakers incorporate those tendencies into every adjustment cycle.
Conclusion
College basketball spread variations on digital sportsbooks continue to reflect the growing influence of data analytics, as operators and bettors alike gain access to increasingly detailed statistical tools that reshape lines in real time. Patterns observed through May 2026 highlight how seasonal reviews feed into future models, ensuring that each new campaign begins with refined baselines that still allow for dynamic movement once betting commences. The interplay between raw performance data, betting volume, and automated risk systems creates a constantly evolving market environment that rewards those who monitor information flows closely.